Contact Us
Address: 6 Maplehurst Close Dartford, Kent DA2 7WX United Kingdom
Email: sales@procureoptima.com
Call: +44 20 3290 3256
Pipeline Platform
A Procurement performance management system with the flexibility of Excel - minus the chaos.
Procurement teams track pipelines in Excel because it’s flexible. We kept that flexibility - and fixed everything else.
Unlimited flexibility. Beautiful dashboards. AI-driven updates.
Not another rigid procurement suite.
Not another messy spreadsheet.
Procurement teams love Excel because it lets them structure work their own way. Add a column. Change a field. Add more detail. Capture nuance. No rigid system ever matches that. But Excel starts falling apart the moment your work involves more than one person.
Where Excel Falls Apart
No Real-Time Collaboration
Teams work in separate files, creating delays and duplication.
Version Confusion
Multiple copies circulate, making it unclear which file is current.
No Access Control
Anyone can edit anything, exposing sensitive data and increasing risk.
No Automatic Dashboards
Reports are built manually, slowing insights and decision-making.
Hard to Consume for Leadership
Spreadsheets hide priorities, risks, and progress.
No Change Tracking
Edits happen without history, leaving no record of what changed or why.
Overstuffed Spreadsheets
Too many columns create clutter and hide what truly matters.
Zero Workflow Automation
Every update relies on manual effort, slowing execution as work grows.
We built a platform that keeps Excel's flexibility and removes all its limitations. It's still your pipeline. Still your fields. Still your structure. Just elevated with collaboration, AI and insights.

Make Your Pipeline Truly Yours
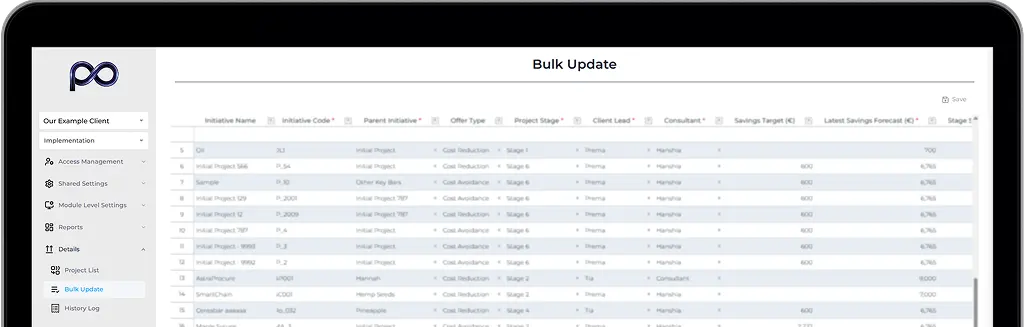
Add any fields you want to track your pipeline.
Customise your dashboards and views. Track historic entries.
Everything is flexible, but nothing breaks your reporting. Excel-level flexibility. Enterprise-level reliability.
Unlimited custom fields
Custom layouts and table views
Custom statuses, stages, and workflows
Custom savings types and validation logic
AI layer to track and summarise changes in each initiative


Custom Dashboards and Views
Turn 40 columns into clean, Consumable insights
Your team can add as many fields as they like.
But senior stakeholders don’t need to see all 40 columns.
We transform your initiative pipeline into:
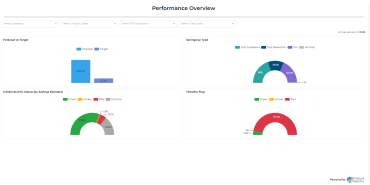
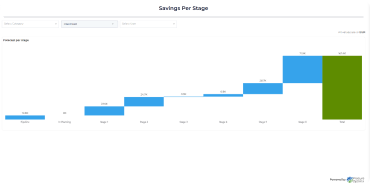
A savings dashboard
Turn every initiative into a measurable savings line, with real-time views of forecast vs realised value across your entire pipeline
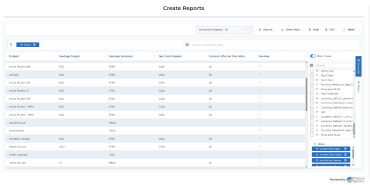
Executive-ready reports
Generate clean, board-ready summaries from detailed data in a few clicks—no manual spreadsheet work, no slide-building required.
Pipeline health maps
Visualise the health of your pipeline at a glance—spot stalled, at-risk, or under-resourced initiatives before they impact savings.
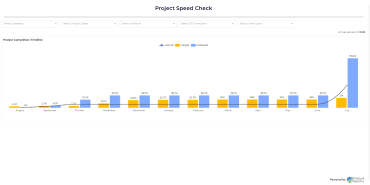
Forecast vs actual timelines
Track how delivery dates are shifting over time, understand the reasons for slippage, and improve the reliability of your pipeline forecasts.
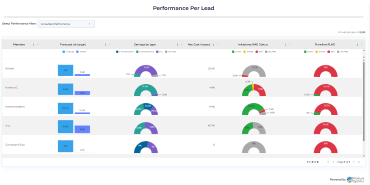
Category and Team member contribution views
See which categories, teams, and buyers are driving results, so you can prioritise support, recognise performance, and rebalance workload.